aTom software, developed by Adding with Solgeo support, is a program for 2D tomographic processing of structures that use sonic and ultrasonic survey methods.
The results of this ultrasonic tomoghraphy provides the distribution of velocity fields along planar sections from the geometric structure of the investigation and measures of flight times of acoustic signals emitted by the transmitters and received by sensors placed on the perimeter of the structure.
The program can import files directly recorded by Solgeo equipment for sonic and ultrasonic measurements mod. CMS or acquisitore Solgeo for Cross Hole measurements in boreholes.
The tomographic method allows to obtain maps of the distribution of the velocity of the waves along planar sections. The starting point is given by the measurement of the propagation times along a large number of paths which, with different inclinations, intersect each other in the area bounded by the positioning geometry of the transmission and reception points.
The velocity fields are obtained by an iterative calculation procedure type S.I.R.T. (Simultaneous Iterative Reconstruction Technique). This is based on the progressive reduction of the deviation between the measured times and the calculated times after the process of “ray-tracing” of pseudo-bending type, which reconstructs the paths of the rays as a function of the velocity field.
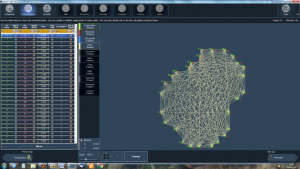
Preliminary data analysis database allows you to select the measurement paths to be used in the preparation, excluding any outliers.
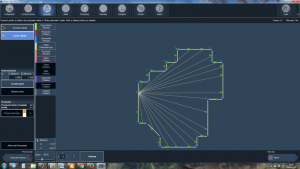
The area of the section to be processed is bounded by a perimeter that is defined by the geometry of the source and receivers, as well as by the shape of the object investigated.
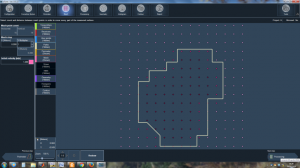
The section is discretized through a rectangular grid in which nodes are determined speed, considering bilinear variations of the same along the mesh. This discretization is justified by the consideration that the waves used, having wavelength nothing, mediate the elastic characteristics of the material in a finite-width band (the first Fresnel zone).
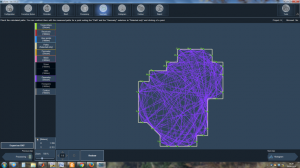
The processing is performed iteratively with a procedure in which, at each iteration, are automatically updated to the speed values corresponding to each node of the grid is reconstructed and then the trend of the paths of the rays as a function of the velocity field and the recalculated Rates the path between transmitter and receiver.
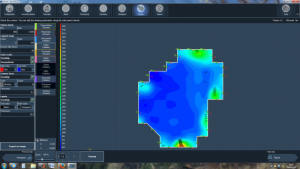
The processing results are presented in the form of color tomograms, which show the variations of the velocity field, associated to the representations of the measurement paths as they are tracked by the procedure of ray-tracing.